![]() MetaForms and MetaNudes etcetera, by author JD SAGE, was written as an art piece to document and address the use of transformations, numbers, symbols and the element of time in art.
MetaForms and MetaNudes etcetera, by author JD SAGE, was written as an art piece to document and address the use of transformations, numbers, symbols and the element of time in art.
AUDIENCE
Educated laypersons interested in art history, the application of mathematics to art and how the arts and sciences interface. Computer artists. Scientists and mathematicians with an interest in the humanities. Professors teaching interdisciplinary courses in both the humanities and the sciences. Instructors of art techniques and the use of digital methodology.
CONTENTS
“MetaForms” details the use of transformations, numbers and symbols in art using examples of JD Sage’s own art work and by referencing images from the Paleolithic, Neolithic and Renaissance and Modern periods. Sage also describes examples of rock art from his own field studies, including petroglyphs of Paleolithic age from the Côa Valley of northern Portugal as well as petroglyphs of Neolithic age from Helleristningene, Alta, in northern Norway. In addition to compelling historical evidence, the book delves into an ancient concept involving the use of time as a dimension in art. Much as the Cubists compressed space into a single plane, Sage explains, the “Timeist” concept in which time is compressed into a single instant. As an added bonus, the book includes a listing of the computer applications used to create many of the transformations discussed and describes the mathematical representation of these transforms. JD Sage has been involved in art for many decades and maintains a studio in Prince Edward Island, Canada.
“I have been exploring “Math Art” over the past 40 years, using mathematical methods to transform and represent images. My Math Art includes: (1)Transformations based on mathematical functions, (2) Progressions formed from numerical sequences, (3) Explorations of compression and reflection in time and space.”
TRANSFORMATIONS :: METAFORMS

My first Math Art was made in 1980. An outline of a photograph of the author was placed onto graph paper to obtain the position of points on the outline. The x and y coordinates of critical points on the image were manually measured. A slide rule was then used to calculate the logarithm to the base 10 of the y coordinates. The x coordinate and the logarithm of the y coordinate were plotted to obtain a transformation of the original image. The outline of the image was then filled in with black India ink. The author was fascinated with the primal feel of the transformed image or metaform (right image, Log Nude).
Additional metaforms were stimulated by the following events. On any given day, I would develop on a blackboard the mathematical description of a particular physical process. When the blackboard surface was fully used, the board was partially erased and the writing was continued over the erased board. At the end of the lecture, the blackboards in the lecture hall would be filled with mathematical symbols and drawings. The blackboard was then partially or completely erased. A few days later the lecture would be continued from where the previous lecture left off. The same set of blackboards would again be filled with a different set of mathematical equations, only to be erased at the end of the lecture. The full mathematical development of the physical system under consideration would often take three or four lectures. The record of these lectures was only preserved in the notes of the students.
An art piece was made using a selected set of lecture notes which was consigned to paper or other suitable surface prepared with a chalkboard surface. Drawings were made to represent a series of one hour lectures on the development of a particular process using mathematical symbols and occasionally graphs, curves or drawings. The first-hour lecture was written in colored chalk on three to six blackboard panels. The second-hour lecture was done in a different colored chalk superimposed on the same three to six panels. The third and occasionally fourth-hour lecture was again done in a different colored chalk and superimposed on the same three to six panels until the development of the process was complete. Below is a completed work consisting of three (48”x48”) panels based on the theory of projection of images in space. In this work the panels were constructed from fiberboard coated with a blackboard paint.
 “Projections and MetaNudes”, 2002. Pastel on chalkboard-treated fiberboard, three panels each 48″x48″
Metaforms or transformations of images are not new. A metaform or transform is an image, object or form which has been in some way modified or transformed from the original. A circle modified to appear as an ellipse; a woman transformed into a bird. Shadows of images falling on oblique walls or curved walls are transformed and represent the earliest transforms. Pliny indicated that the early Greeks believed that the art of painting started with the tracing of the outline of a shadow of a man [Pliny, LCL 394 (1999) Natural History, IX. Book 35:15. Translated by H. Rackman, ed. G. P. Goold. Cambridge, MA: Harvard University Press]. Other early transformations are images conceived and depicted on the walls of caves, rock outcrops and other natural surfaces. They are collectively called rock art. Some images are painted on rock and others called petroglyphs are carved, pecked or scratched into the surface of rock.
PROGRESSIONS :: SEQUENCES
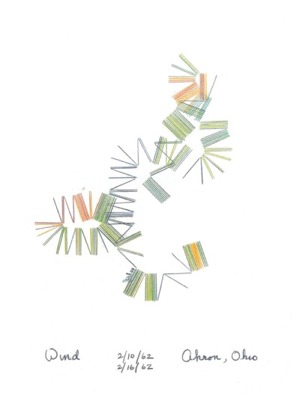 “Wind: Akron, Ohio”, 1979.
Pastel and pencil on mount board, 24″x32″.
The use of number is innate. Early man might not have had the number system we are most familiar with, but even they had a way of signifying, one or none, more than one, and more. They probably used their toes and fingers or digits to count. The concept is carried over to contemporary man for which the term digital refers to the representation of information and data by discrete units or digits. Examples of the use of number as tokens on clay tablets are found in the Sumerian culture (5,000 BP) http://it.stlawu.edu/~dmelvill/mesomath/sumerian.html. Paleolithic man (20,000 BP) scratched lines and gouged holes in sticks and bones, possibly counting the days between phases of the moon http://www.physics.nist.gov/GenInt/Time/ancient.html. Without counting, we are aware of objects in groups of two, three, four and five. Beyond five, counting may be required or we assign the collection a name.
One example of numerical art is the use of the stochastic progression. This progression is a sequence in which each new term of the sequence is obtained from a probability distribution and a relationship to a number of earlier non-contiguous terms.
This procedure may be applied to generate a sequence of terms representing a physical process. Here (left) is a drawing using an application of this procedure. In this work, both the speed and direction of the wind were treated as stochastic variables. A sequence of wind direction and speed was generated using the statistical values from the meteorological data for Akron, Ohio. Colored lines having equal length were plotted and oriented in the direction of the hourly wind. The color of the line was based on the value of the generated wind speed. An art work based on a new sequence would lead to a similar but different form. The procedure may also be used to produce three and four dimensional art works.
EXPLORATIONS :: TIMIST ART
 “Women Time”, JD SAGE
Recently, I have been interested in iconographic ways to capture the passage and representation of time. The “Cubists” compressed space into a single plane. “Timists” compress time into a single instant. In the Kimberly’s of Australia, early artists used superimposition of images spanning as much as 20,000 years [Walsh, Grahame (2000) Bradshaw Art of the Kimberleys. North Carlton, Australia: Takarakka Rock Art Publications.] For composers, time is compressed on a sheet of music. A visit to the Grand Canyon is a “timist” event, particularly when we are made aware of the fact that the canyon walls and gorge represent hundreds of millions of years of geologic events.
The multidimensional work shown below contains two sets of glass. Each set contains four panes of glass separated from each other, to permit looking forward and backward through time. In the first set, an image from 2 BP (years before present) is placed on the first pane of glass, an image from 6,000 BP is placed on the second pane and an image from 20,000 BP is placed on the third pane. The equations for time travel are placed on the fourth pane. In the second set, the time sequence of the images are placed on glass in reverse order and represent images from 20,000, 6,000 and 2 years BP. Mirrors are incorporated in the work to permit the viewer to be a part of the work.
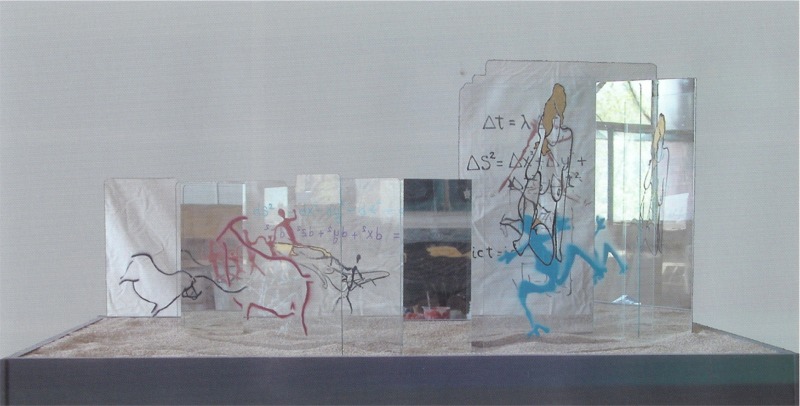 “Time Travel”, 2002. Acrylic and gold leaf on glass pieces, 9″x15″.
